IoT Data Visualization with CC2650 SensorTag
December 5, 2017
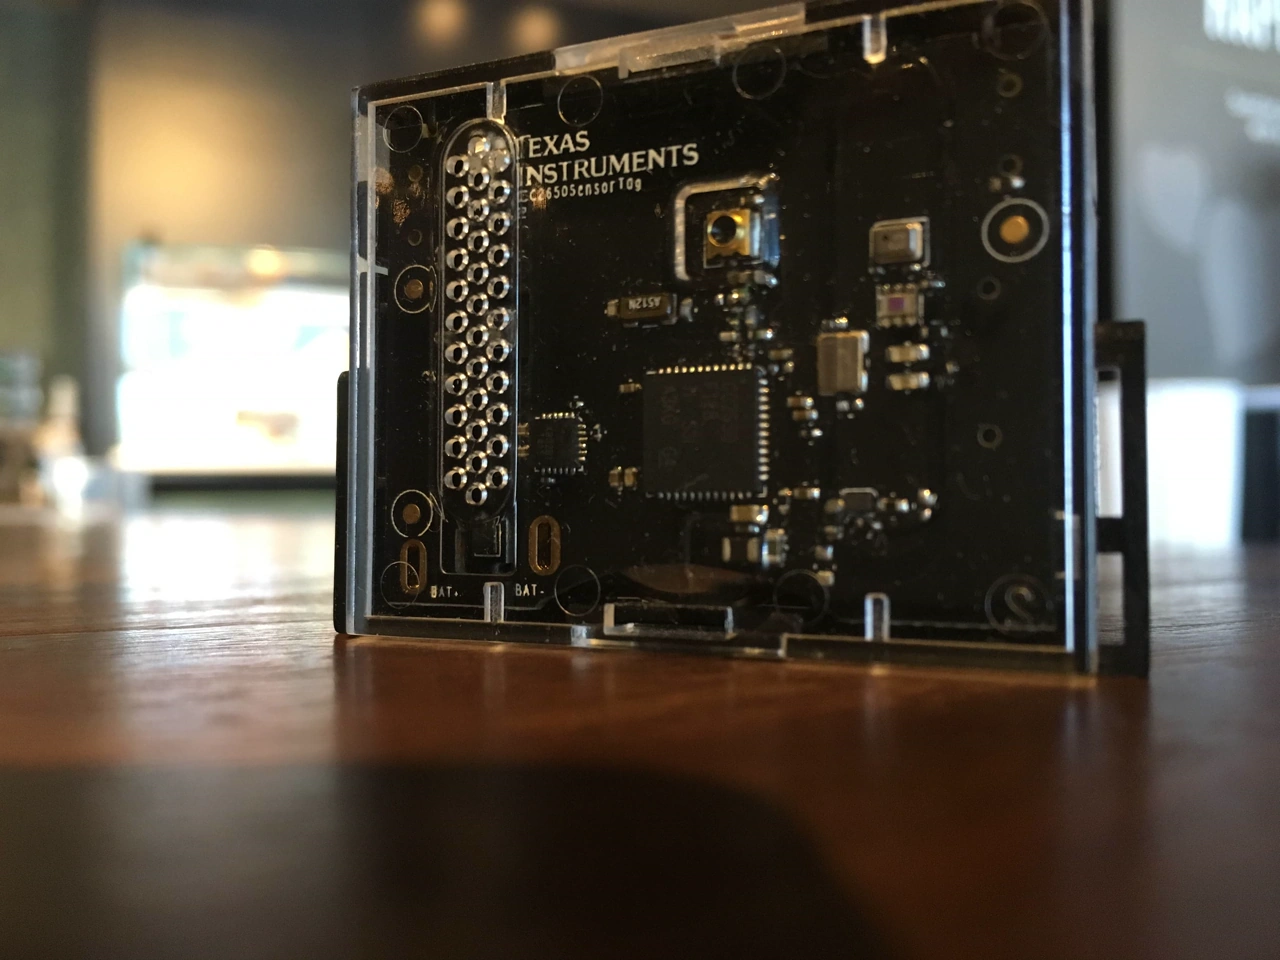 Figure: Photo of my CC2650 sensor
Overview
Texas Instruments’ CC2650 SensorTag is a compact sensor platform that captures real-world data such as acceleration and temperature, enabling rapid prototyping for IoT applications. The SensorTag can easily connect to your smartphone via Bluetooth using the TI SensorTag App. The app not only displays sensor readings in real time but also allows you to forward that data to IBM’s QuickStart platform over Wi-Fi with the press of a button.
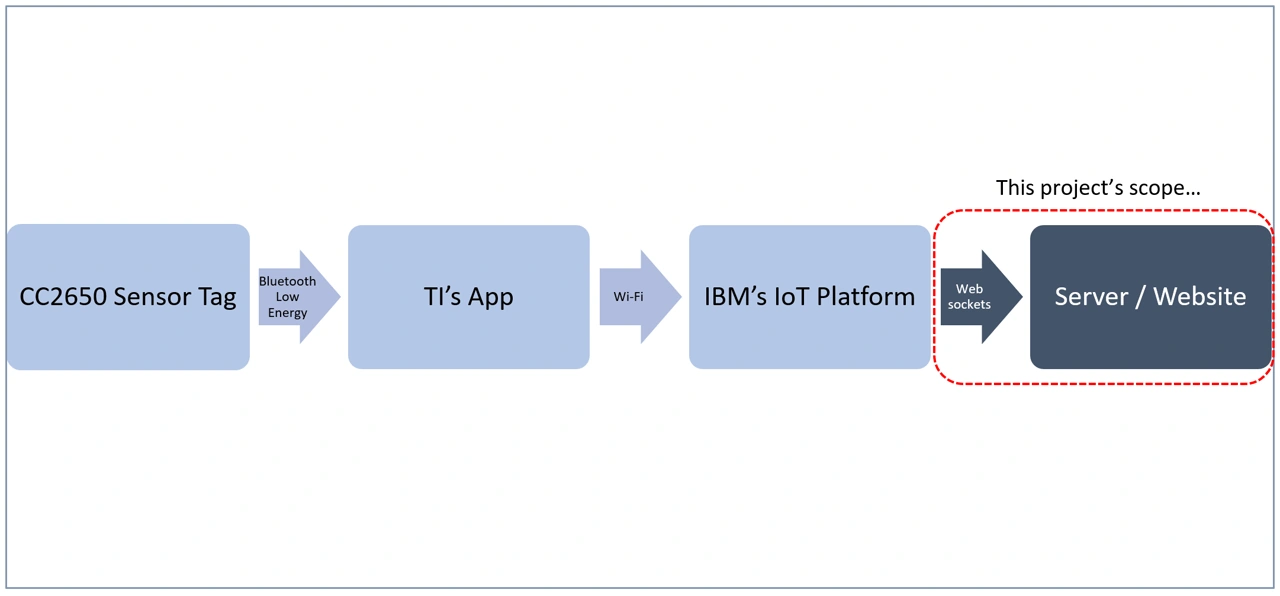
While IBM’s platform offers tools for analyzing data and hosting IoT applications, this project takes a different approach. Instead of building on IBM’s dashboard, it uses Node-RED and WebSockets to extract data from IBM’s cloud and forward it to a custom-built web interface. The diagram below illustrates the overall system architecture and highlights the parts built specifically for this demo:
How It Works
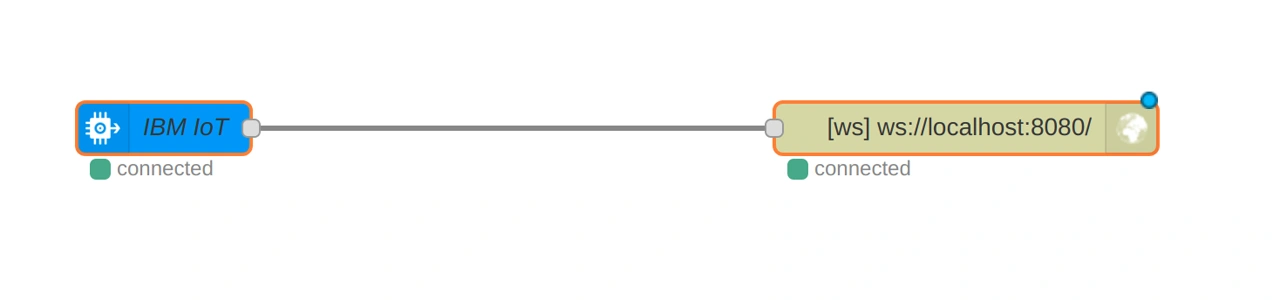
The backend server is built with Node.js, which integrates Node-RED—a visual programming tool that simplifies data flow handling by allowing developers to connect logic blocks like a flowchart.
To retrieve data from IBM’s cloud, the ibmiotapp module in Node-RED is used. It subscribes to the SensorTag’s data stream. This data is then piped through Node-RED’s WebSocket node and sent to the Node.js server.
The server uses WebSockets to forward the data to the front-end webpage, where the raw values are displayed using HTML, CSS, and JavaScript. For better visualization, Google Charts is integrated to render real-time graphs of the SensorTag’s x, y, and z acceleration data.