Real-Time IoT Data Visualization with Arduino 101 and MEAN Stack
August 8, 2021
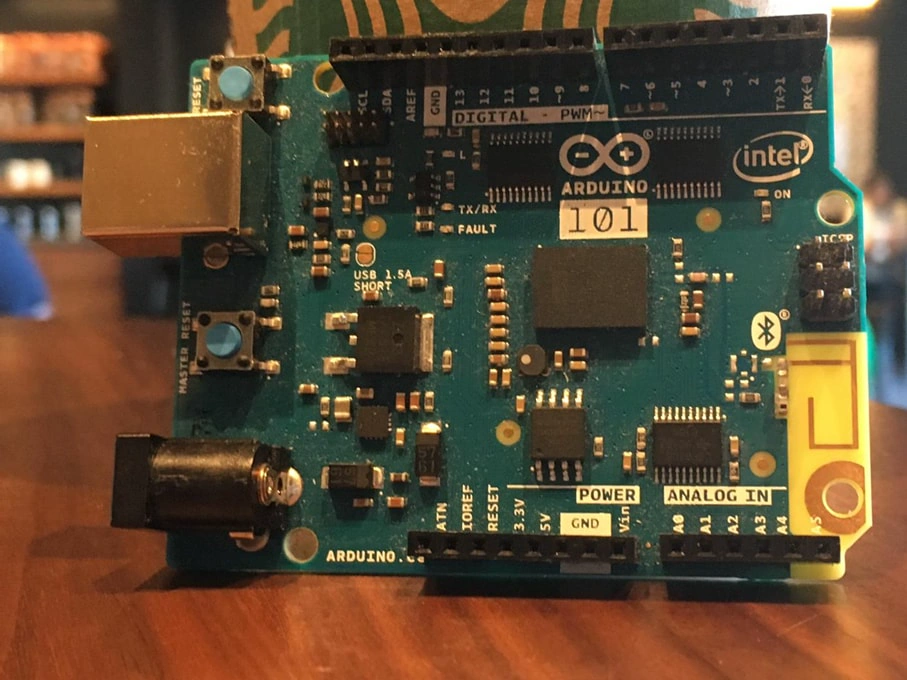 Figure: Photo of my Arduino101
Overview
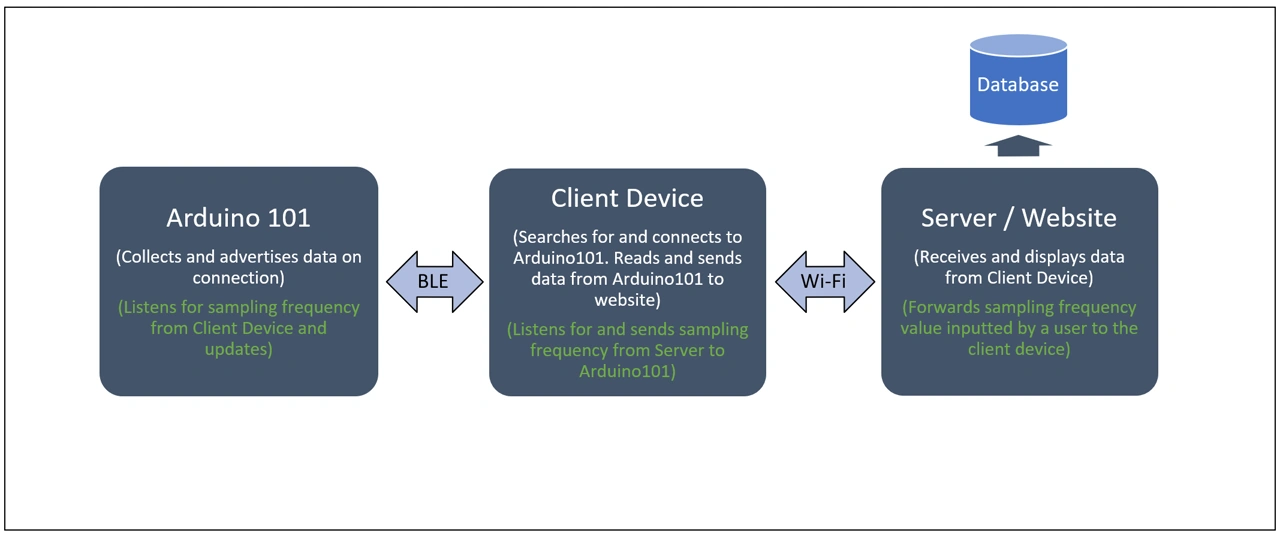
This project showcases a real-time IoT system integrating an Arduino 101 (based on the Intel Curie module) with a MEAN stack (MongoDB, Express, AngularJS, Node.js) RESTful API server. The Arduino 101 collects motion data — specifically acceleration and gyroscope readings — and broadcasts it over Bluetooth Low Energy (BLE).
A client device connects to the Arduino 101 via BLE, retrieves the advertised data, and forwards it over Wi-Fi to a Node.js server. The server stores the data in MongoDB and simultaneously pushes it to a web frontend, where the data is visualized in real time. From this webpage, users can remotely adjust the Arduino 101's sampling frequency, with changes reflected almost instantly (accounting for the combined latency of BLE transmission, Wi-Fi transfer, and the Arduino’s processing loop) both in the data flow and visualizations.
The diagram below illustrates the system architecture:
How It Works
Arduino 101
The Arduino 101 firmware is written using standard Arduino code with the CurieBLE and CurieIMU libraries. The board acts as a BLE peripheral, exposing one service with seven characteristics:
- Six read-only characteristics: acceleration (
ax,ay,az) and gyroscope (gx,gy,gz) data - One writable characteristic: sampling frequency (
ts)
Each characteristic is assigned a UUID, allowing the client to subscribe, read, write, or receive notifications.
Client Device
A Node.js script on the client device uses the Noble library to discover and connect to the Arduino 101 over BLE. Once connected, it subscribes to the service and enables notifications for all seven characteristics.
Using Socket.io, the client streams sensor data and sampling frequency changes to the Node.js server in real time.
Why Socket.io instead of WebSockets?
Socket.io was chosen for its simplified multiplexing capabilities. Unlike vanilla WebSockets, Socket.io allows multiple event streams over a single connection with less overhead and an easier API.
Server & Web Interface
The server, built with Node.js and Express, receives sensor data via Socket.io and stores it in MongoDB. It also uses Socket.io to broadcast updates to the web frontend.
The webpage is built with AngularJS and styled using Bootstrap. Sensor data is visualized with Google Charts, providing real-time graphs of accelerometer and gyroscope values. Users can interact with the interface to change the Arduino 101's sampling frequency. These changes propagate back instantly through the same pipeline and are immediately reflected in the incoming data stream.